Comparing time periods
Every metric can be compared against an earlier window, so you can see what went up or down.
Set the comparison
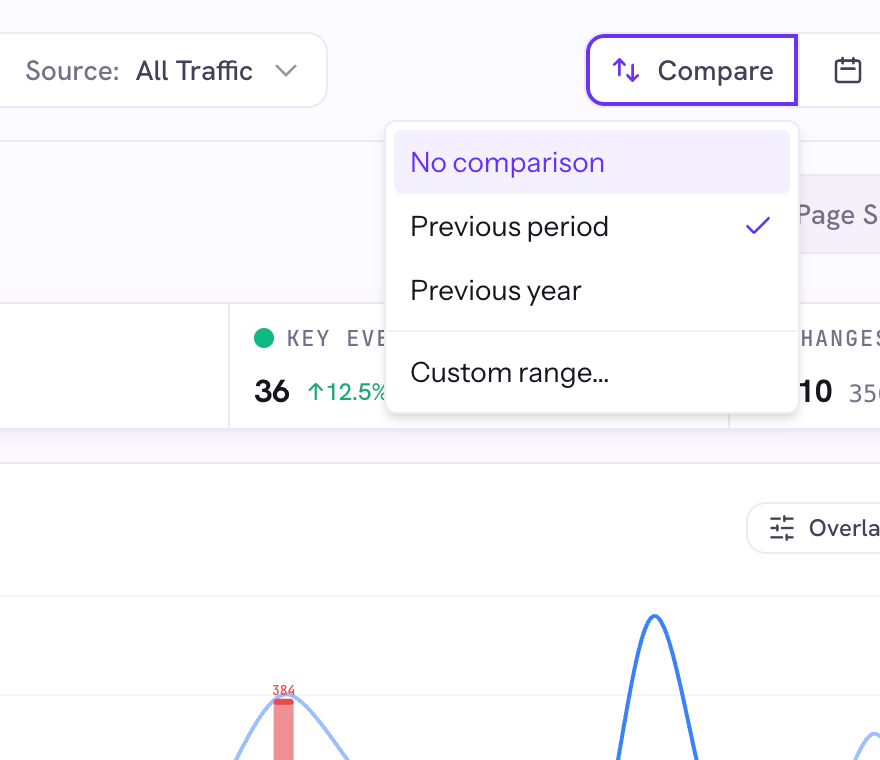
Click Compare in the top bar and choose Previous period, Previous year, or a Custom range. The stat cards then show a percentage change, and the chart can overlay the comparison line.
Read the indicator
When comparison is on, the Compare button turns purple and its icon fills in. Hover it to see the exact comparison dates.
Good to know
- If the comparison window starts before your earliest data, a banner warns you the numbers may be incomplete. Use Disable Comparison to clear it.