Compare GSC and GA4 Performance Before and After Any Page Changes
Why This Matters
Most teams make changes without ever clearly validating whether those changes helped, hurt, or did nothing at all. When performance shifts weeks or months later, it becomes difficult to connect cause and effect with confidence.
This workflow makes it easy to see what changed, when it changed, and how key metrics behaved before and after specific changes.
This workflow makes it easy to see what changed, when it changed, and how key metrics behaved before and after specific changes.
How to Do It in Page Pulse
-
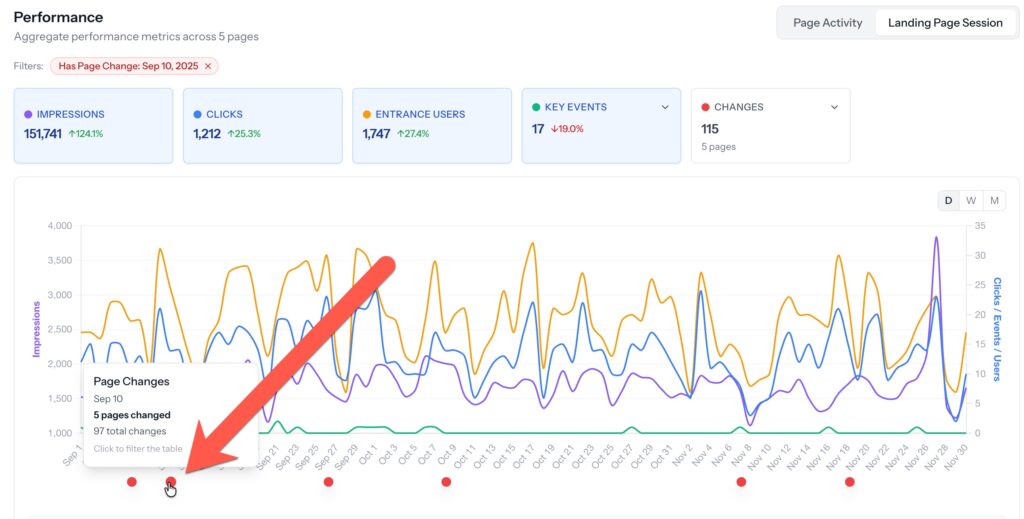
Open your Project Dashboard

-
Select the date(s) on the performance chart of the changes you want to analyze (optionally use the "Changes" box drop-down to filter to changes for specific elements)
-
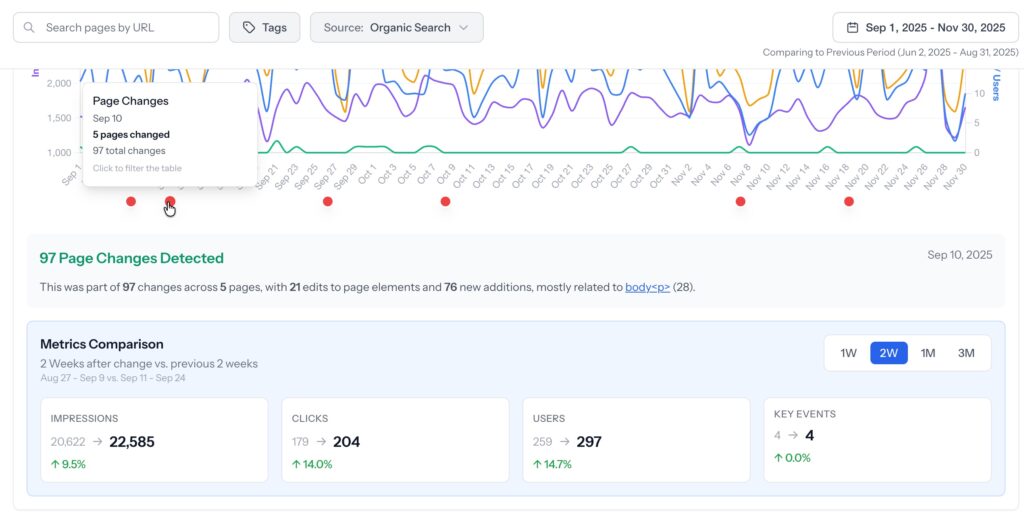
The total changes across the total number of pages with a summary will be displayed. View before/after metrics for 1 week, 2 weeks, 1 month, and 3 months.
-
Optional: Filter to specific page metrics using the search bar at the top left. Page change summaries and metrics will automatically adjust.
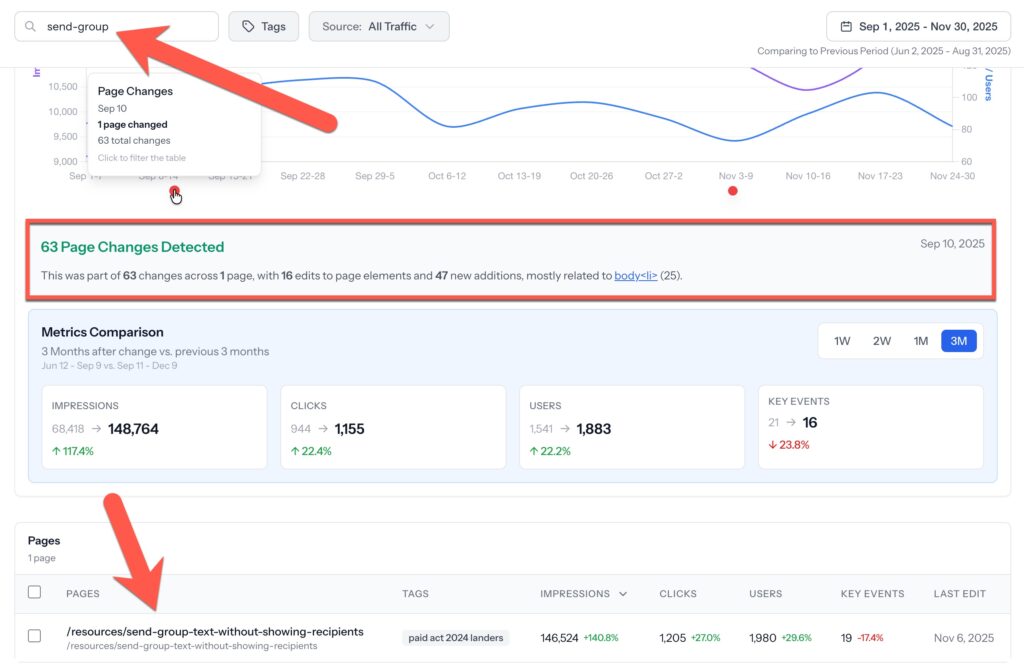
- Optional: Click on any page in the table to view a detailed breakdown of what changed (edited, added, removed) by element.
Requirements
- Google Search Console connected to the project
- Google Analytics 4 connected to the project
- At least 30 days of data before and after the change date
What You Can Decide Next
- Stronger confidence knowing whether a specific page change had a positive, negative, or neutral impact
- Which types of changes are worth repeating across other pages
- Whether performance shifts were likely caused by the change or by external factors
- When to roll back, refine, or double down on a specific update
What Page Pulse Connects
- Automatic, daily, page-level change history
- Google Search Console clicks, impressions, and queries
- GA4 sessions and key events
- Time-based performance visualization
Demo